PGF/TikZ 是 Till Tantau 开发的基于 TeX 的绘图引擎。因其可以直接在 LaTeX 文稿中通过代码绘制向量图,所以是目前流行的 LaTeX 绘图解决方案之一。
在 tikzpicture 环境或者 \tikz 命令的参数中,可以通过 scale 选项来缩放绘制的图形。然而,这种缩放不会同步应用在 node 中的文字上,导致图形与 node 中的文字注解大小失衡。
我们来解决这个问题。
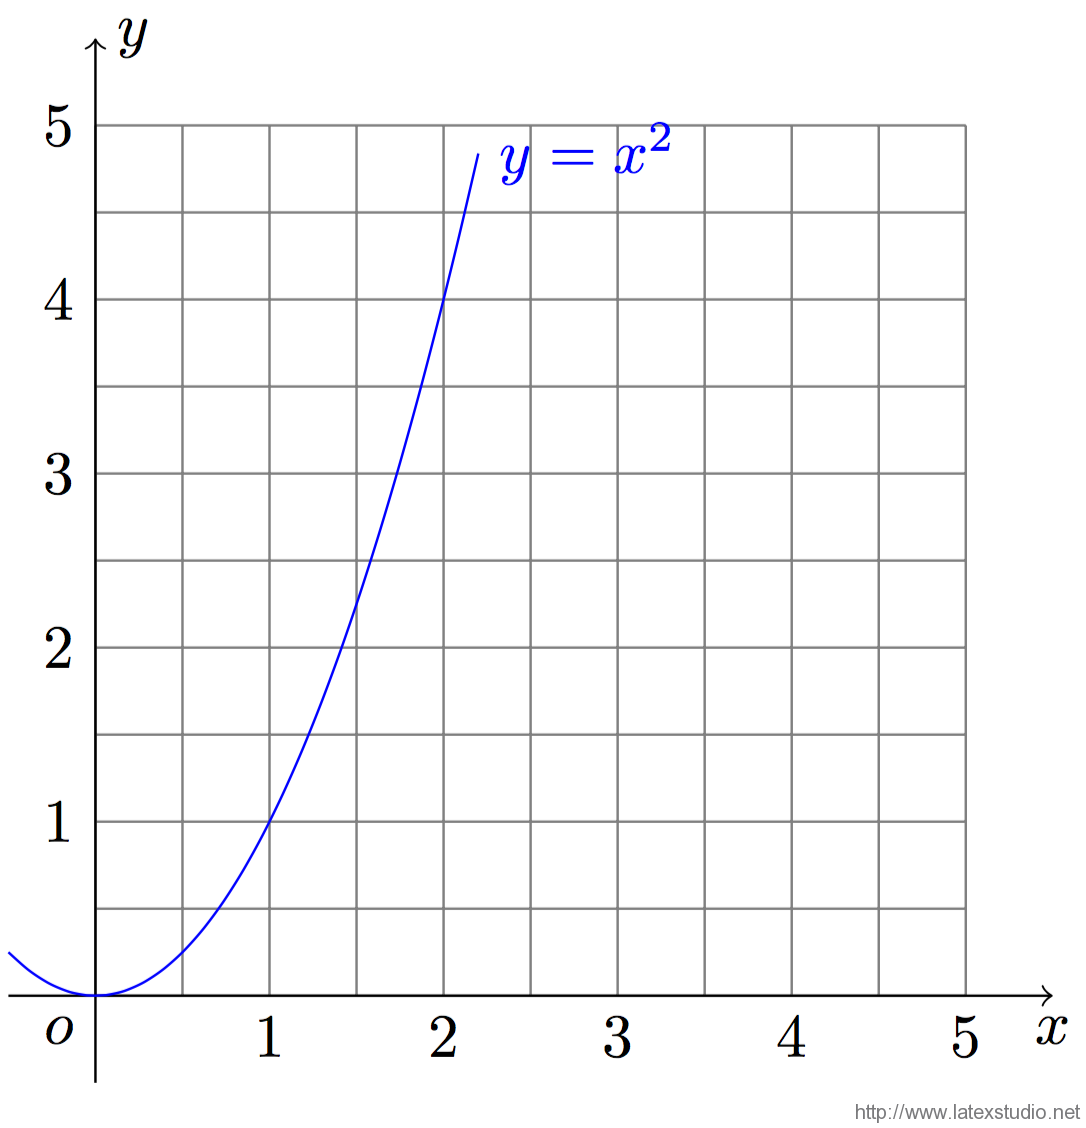
绘制一个函数图像
现在,比如说我们绘制一个最简单的二次函数的图像。\begin{tikzpicture}
\draw[gray, step = 0.5cm] (0, 0) grid (5, 5);
\draw[->] (-.5, 0) -- (5.5, 0);
\draw[->] (0, -.5) -- (0, 5.5);
\node[anchor = north east] at (0, 0) {$ o $};
\node[anchor = north] at (5.5, 0) {$ x $};
\node[anchor = west] at (0, 5.5) {$ y $};
\foreach \x in {1, ..., 5} {
\node[anchor = north] at (\x, 0) {$ \x $};
\node[anchor = east] at (0, \x) {$ \x $};
}
\draw[domain = -0.5:2.2, smooth, variable=\x, blue]
plot ({\x}, {\x * \x})
node[anchor = west] {$ y = x^2 $};
\end{tikzpicture}
 放大之
放大之
现在,你觉得这张图太小。于是你考虑给 tikzpicture 环境加上 scale = 2 来放大它。
\begin{tikzpicture}[scale = 2]
  \draw[gray, step = 0.5cm] (0, 0) grid (5, 5);
  \draw[->] (-.5, 0) -- (5.5, 0);
  \draw[->] (0, -.5) -- (0, 5.5);

  \node[anchor = north east] at (0, 0) {$ o $};
  \node[anchor = north] at (5.5, 0) {$ x $};
  \node[anchor = west] at (0, 5.5) {$ y $};
  \foreach \x in {1, ..., 5} {
    \node[anchor = north] at (\x, 0) {$ \x $};
    \node[anchor = east] at (0, \x) {$ \x $};
  }

  \draw[domain = -0.5:2.2, smooth, variable=\x, blue]
        plot ({\x}, {\x * \x})
        node[anchor = west] {$ y = x^2 $};
\end{tikzpicture}
 于是你发现,整个图像确实放大了。但是其中的说明注解还是老样子,没有放大。这样一来,相比整个图像,注解文字就显得比较小。也许
 scale = 2 的状态,看起来还算匀称,但若是 scale = 10,那么文字部分就小弱蚊蝇了。
另一方面,有些图像,其注解文字和图像内容是匹配好的。强行缩放之后,可能破坏好这种预先设置匹配,也不完美。
因此,我们得想办法解决。
全局缩放
问题的原因在于,TikZ 中的node,其内容、样式都是单独设置的,全局的 scale 设置无法影响 node 的内容。因此,我们有必要定义一个 global scale 的参数,统一地设置两部分的缩放比例。
\tikzset{global scale/.style={
    scale=#1,
    every node/.append style={scale=#1}
  }
}
\begin{tikzpicture}[global scale = 2]
  \draw[gray, step = 0.5cm] (0, 0) grid (5, 5);
  \draw[->] (-.5, 0) -- (5.5, 0);
  \draw[->] (0, -.5) -- (0, 5.5);

  \node[anchor = north east] at (0, 0) {$ o $};
  \node[anchor = north] at (5.5, 0) {$ x $};
  \node[anchor = west] at (0, 5.5) {$ y $};
  \foreach \x in {1, ..., 5} {
    \node[anchor = north] at (\x, 0) {$ \x $};
    \node[anchor = east] at (0, \x) {$ \x $};
  }

  \draw[domain = -0.5:2.2, smooth, variable=\x, blue]
        plot ({\x}, {\x * \x})
        node[anchor = west] {$ y = x^2 $};
\end{tikzpicture}
 如此一来,
如此一来,node 中的内容,就会同步比例地缩放了。
选自:https://liam0205.me/2017/07/23/global-scale-for-TikZ-picture/


发表评论 取消回复