我们在读外文文献的时候,经常看到一个定理左边是一个竖线,右边是定理内容,觉得非常精致,到底LaTeX是如何定制的呢?
见下图: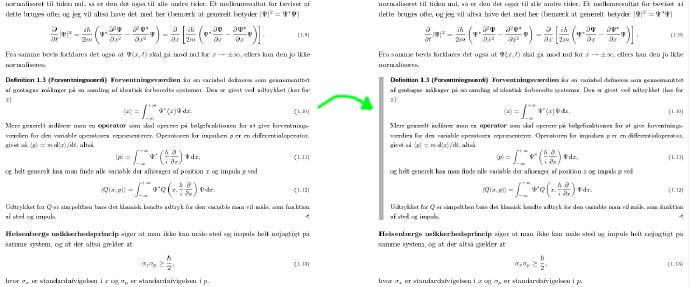
下面是我定制的样图示例: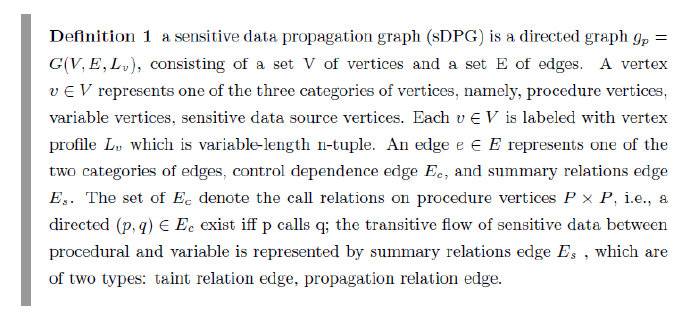
定制代码如下:\documentclass{article}
\usepackage{amsmath,amsfonts,bm}
\usepackage{ctex}
\usepackage[amsmath,thmmarks,framed]{ntheorem}
\theoremstyle{plain}
\theorembodyfont{\small}
\usepackage{framed}
\usepackage{color}
\definecolor{gray}{rgb}{0.6,0.6,0.6}
\renewcommand*\FrameCommand{{\color{gray}\vrule width 5pt \hspace{10pt}}}
\newframedtheorem{defn}{Definition}
\newframedtheorem{thm}{Theorem}
\newcommand\R {\mathbb{R}}
\newcommand\T {\mathbb{T}}
\newcommand\mx {\bm x}
\newcommand\my {\bm y}
\newcommand\mg {\bm g}
\begin{document}
\begin{defn}
a sensitive data propagation graph (sDPG) is a directed graph ${g_p} = G(V,E,{L_v})$, consisting of a set V of vertices and a set E of edges.A vertex $v\in V$ represents one of the three categories of vertices, namely, procedure vertices, variable vertices, sensitive data source vertices. Each $v\in V$ is labeled with vertex profile $L_v$ which is variable-length n-tuple. An edge $e\in E$ represents one of the two categories of edges, control dependence edge $E_c$, and summary relations edge $E_s$. The set of $E_c$ denote the call relations on procedure vertices $P\times P$, i.e., a directed $(p,q) \in {E_c}$ exist iff p calls q; the transitive flow of sensitive data between procedural and variable is represented by summary relations edge $E_s$ , which are of two types:taint relation edge, propagation relation edge.
\end{defn}
\end{document}


投稿

微信公众账号
微信扫一扫加关注
评论 返回
顶部
发表评论 取消回复