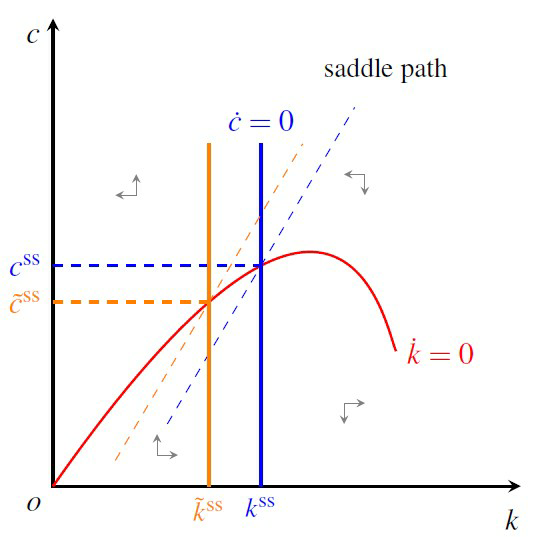
代码如下:
\documentclass{standalone}
% some basic package
\usepackage{amsmath,amssymb}
\usepackage{tikz}
\usetikzlibrary{intersections,calc}
% font setting
\usepackage{mathptmx}
\usepackage[scaled=.90]{helvet}
\usepackage{courier}

\begin{document}

\begin{tikzpicture}[>=stealth,thick,scale=1.2]
% draw the axes
\draw[,thick](0,4.5) node [label=-100:$c$] (yaxis) [above] {}--(0,0) node [below left]{$o$}--(4.5,0) node [label=-100:$k$] (xaxis) [right] {};

% draw the motion of capital
\draw [color=red,name path=curve] (0,0) .. controls (2.8,4) and (3.2,1.5) .. (3.3,1.3) node[right]{$\dot{k}=0$};

% draw the initial motion of consumption
\draw [color=blue,name path=initial](2,0) coordinate (a1) node [below]{\small $k^{\rm ss}$}--(2.0,3.3) coordinate (a2) node [above] {$\dot{c}=0$};
% find the initial steady state
\draw [blue,dashed,name intersections={of=curve and initial,by={iniss}}]
(iniss -| yaxis)node [left]{$\small {c}^{\rm ss}$}--(iniss);
% draw the saddle path of the initial state
\draw [dashed,blue,thin](1.1,0.6)--($(1.1,0.6)!2.0!(iniss)$);

% draw the second motion of consumption
\draw [color=orange,name path=second](1.5,0) coordinate (b1) node [below]{\small $\tilde{k}^{\rm ss}$} -- (1.5,3.3) coordinate (b2);
% find the second steaty state
\draw [orange,dashed,name intersections={of=curve and second,by={secss}}]
(secss -| yaxis) node [left]{$\small \tilde{c}^{\rm ss}$}--(secss);
% draw the second saddle path of the second state
\draw [dashed,orange,thin]($(secss)-(iniss)+(1.1,0.6)$) -- +($(1.1,0.6)!2.0!(iniss)-(1.1,0.6)$);

% label the saddle path
\draw (3.2,4) node{\small saddle path};

% the motion phase
\begin{scope}[,very thin,gray]
\draw (0.6,2.8)--(0.8,2.8)--(0.8,3.0);
\draw (1.0,0.5)--(1.0,0.3)--(1.2,0.3);
\draw (2.8,3.0)--(3,3.0)--(3,2.8);
\draw (2.8,0.6)--(2.8,0.8)--(3.0,0.8);
\end{scope}

\end{tikzpicture}

\end{document}
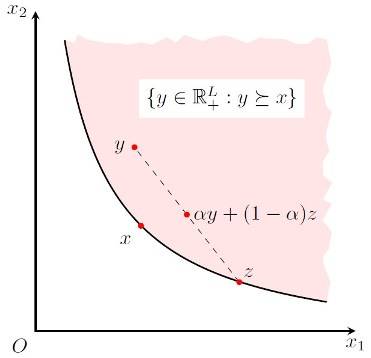
效果图: 另一个在 TikZ 下画凸偏好关系的方法。参见代码:
\documentclass{standalone}

\usepackage{amsmath,amssymb}
\usepackage{tikz}
\usetikzlibrary{decorations.pathmorphing}

\begin{document}

\begin{tikzpicture}[>=stealth,decoration={random steps,segment length=2mm}]
% draw the axes
\draw[,thick](0,5.5) node [left] {$x_2$}--(0,0) node [below left]{$O$}--(5.5,0) node [below] {$x_1$};

% draw the better than set
\fill [draw,red!10] (.5,5) .. controls (1,2) and (2,1) .. (5,0.5) decorate{-- (5,5) -- cycle};

% draw the indifferenc curve and marked with domain.
\draw [thick] (.5,5) .. controls (1,2) and (2,1) .. (5,0.5);
\node at (3.2,4) [fill=white] {$\{y\in\mathbb{R}^{L}_{+}: y\succeq x\}$};

% draw point x
\node [fill=red,circle,inner sep=1pt,label=below left:$x$] at (1.81,1.81){};

% draw line segment
\draw [dashed,circle,inner sep=1pt] (3.5,0.84) node [fill=red,label=above right:$z$] {}-- (2.6,2)node [fill=red,label=right:$\alpha y+(1-\alpha)z$]{}--(1.7,3.16)node[fill=red,label=left:$y$]{};
\end{tikzpicture}

\end{document}
效果图: 选自:http://ddswhu.tk/archive/phase-diagram-of-Ramsey-model-with-capital-tax-drawing-with-tikz/http://ddswhu.tk/archive/convex-preference-drawing-with-tikz/


发表评论 取消回复